Real-time Scatter3D Embedded in QWidget-based Application
This article is to summarize my recent research on how to use the Scatter3D QML graph in the Qt project. There were not sufficient documents and examples that explained how you can use a Qt Quick component in a QWidget-based application, and also how you can manipulate objects in the graph from C++ code, as far as I searched.
The reason why I use the Scatter3D QML over the Q3DScatter class while Q3DScatter has better integration with the QWidget application is that the Scatter3D supports features like legends out-of-the-box, which are more difficult to implement with Q3DScatter, as described in this forum entry.
Qt Forum - Copying C++ Object Data to QML Object (Example: Q3DScatter to Scatter3D)
I created a GitHub repository for this demo named scatter3d-in-qwidget, so you can check all of the source code from there.
GitHub - ttktjmt/scatter3d-in-qwidget
Supported Rendering APIs for Qt Quick 3D
According to Qt Quick 3D documentation, Qt Quick 3D requires at least one of the following APIs:
- OpenGL 3.3+ (support from 3.0)
- OpenGL ES 3.0+ (limited support for OpenGL ES 2)
- Direct3D 11.1
- Vulcan 1.0+
- Metal 1.2+
It’s worth mentioning that you should check your device's OpenGL version when you have some trouble with 3D objects in the graph.
QQuickView v.s. QQuickWidget
There are currently two ways to use Qt Quick components in a QWidget-based project: QQuickView with QWidget::createWindowContainer(), and QQuickWidget. Of course there are pros and cons, but when you want to embed the graph partially in an existing Qt Widgets application, you would need to use QQuickWidget since the QQuickView component is not resizable and only visible in a fixed rectangular area of a display.
So, to summarize the usage of both classes,
QQuickView: high-performance, but not resizableQQuickWidget: flexible, at the expense of performance
In this article, I use QQuickWidget, assuming that you need to integrate Qt Quick Content partially into the existing large-scale QWidget-based project.
Set up 3D Scatter Graph
-
Make sure that the following components were already added from the Qt Maintenance Tool:
-
Qt Quick 3D
- Additional Libraries / Qt 3D
- Additional Libraries / Qt Data Visualization
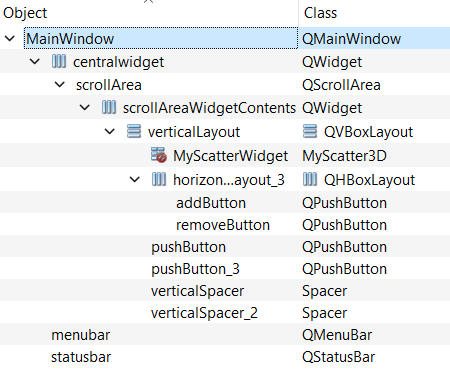
After creating a Qt Widgets Application on Qt Creator, I added several random components with QWidget (this will be promoted to the custom class I will declare later on) in the same scrollAreaWidget to test if the scatter graph was correctly set partially in the qt widget application.
Create a Wrapper Class of Scatter3D in C++
Add a new C++ Class (h/cpp) with the base class as QWidget (I named this class as MyScatter3D in the example project). From the design tab, you can promote the QWidget component to the MyScatter3D class by adding the class on the “Promoted Widgets” dialog.
Declare the Scatter3D with QML files
Declare the Scatter3D graph with a new QML file named graph.qml, and source the qml file to a new QQuickWidget instance declared in the wrapper class constructor.
You can enable touch gestures on Android devices with the setAttribute(Qt::WA_AcceptTouchEvents) statement.
Interacting with QML Objects from C++ file
You can get pointers to the QML objects declared in the QML file with findChild method.
dataView = quickWidget->rootObject()->findChild<QQuickItem*>("dataView");
It’s important to know that this method searches for an object with its name, not an ID. So, don't forget to add an objectName attribute to the target object.
I added three public slots; AddPlot, RemovePlot, RealTimePlot in the MyScatter3D class, and connected them with two buttons and a timer instance respectively. All functions declared in the C++ file are calling functions declared in the QML file with QMetaObject::invokeMethod(object, "function_name") method. You can now add/remove a plot from buttons, and also see the real-time pointer moving randomly in the graph.
Somehow you need to find the object every time you call the function, and it cannot be stored as a member variable. There might be some ways to solve this problem.
Result
Now, you can see the graph in a scroll area, with a real-time plot moving randomly in the graph. Also, you can manipulate the purple plots with 2 buttons above the graph.

Structure of this application.